GraphViz
GraphViz is an awesome way to visualize your code when debugging problems, and it is trivial to setup.
Sometimes you need to visualize data structures in your code. GraphViz is your friend. I’ve been working on a live coding project in my spare time. This weekend I worked on a parser for the little music language I’ve been working on. Here’s an example line of code from the language:
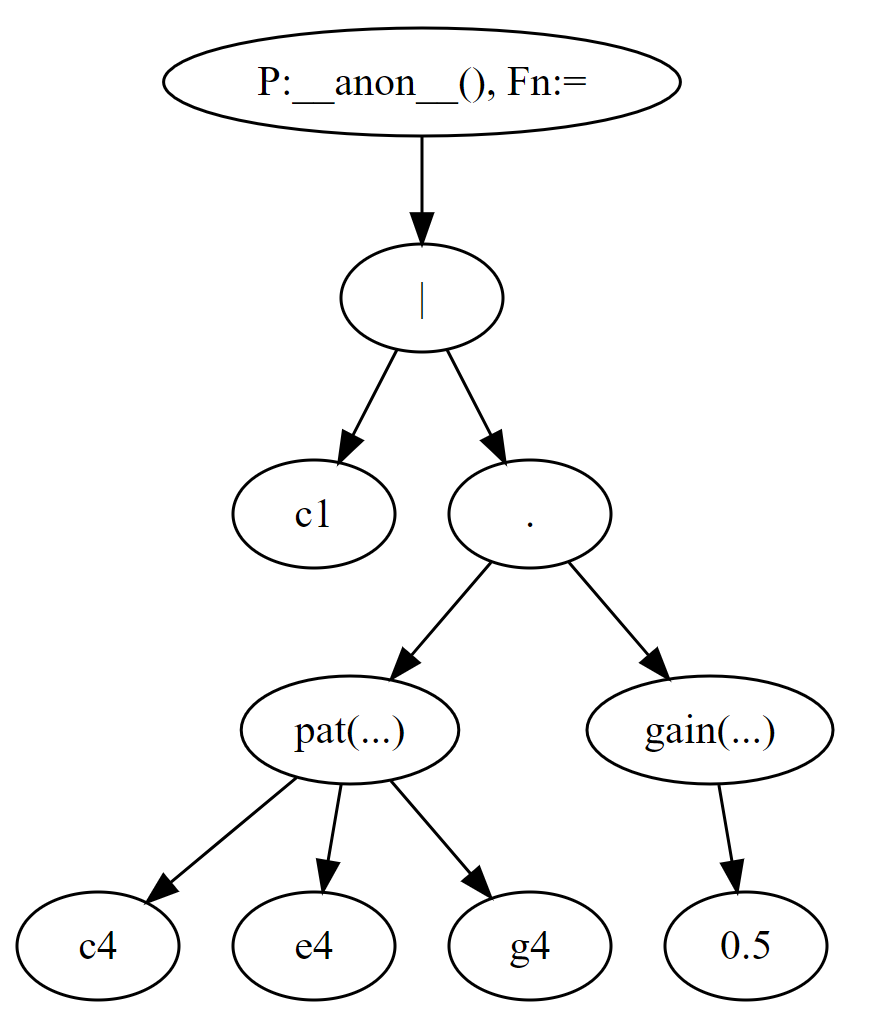
c1 | sound(c4 e4 g4).gain(.5)
Although the language is not fully specified yet, this is a simple fragment, and enough to get me started. The language itself is an experiment based on patterns (like Tidal Cycles) - and may well be one of several different experiments I do. Briefly, this fragment means ‘make a list of 3 notes (CEG), and apply .5 gain to it, then ‘pipe’ it into audio channel 1.
If you aren’t familiar with writing compilers, the basic idea is usually to decompose the code into ‘tokens’ and then build a connected tree of the tokens using a parser. The resulting data structure is called an Abstract Syntax Tree. Once you have the AST, you can use it to generate the program you want to run. The tree essentially shows you how to interpret the program. The problem we have now is to check that the tree is correct. We could just plough on and start building code fragments from the tree, but it would be nice if we could look at it.
I generate visualisations of tree structures by outputing the tree as a ‘dot’ file representation. This has been very useful on several occasions.
Dot files are a really simple format, especially if you just want a basic visualization. To build a dot file, you just list every pair of node/child links in a text file. You just need each node to have a unique Id. If you provide ‘label’ lines, you can also change the text of the node in the display - but you don’t even have to do that if the node labels are nicely formed.
Here’s an example:
digraph AST
{
    Node_1 [label = "My Node 1"];
    Node_3 [label = "My Node 3"];
    Node_Out [label = "My Node Out"];

    Node_1 -> Node_Out;
    Node_3 -> Node_Out;
}
It is trivial to write the above to debug output; assuming you can convert your node ID to a valid string, and you have a friendly name for it:
std::ostringstream str;
str << "digraph AST\n"

// Make the labels: not usually necessary
for(auto& node : nodes)
    str << to_string(node.id()) << " [label = \"" << node.name() << "\"];\n";

// Make the connections (every node to every child it has)
for auto& node : nodes)
{
    for(auto& child : node.children)
    {
        str << to_string(node.id()) << "->" << to_string(child.id()) << ";\n";
    }
}

str << "}\n";

// Log it however you want
std::cout << str.str();
The great thing about this is you don’t even have to install graphviz. Just go to http://webgraphviz.com and paste your text. You can download graphviz instead if you need to keep your data structure private, but I mostly just paste my tests into the site. Here’s what happens if you paste the digraph into webgraphviz:
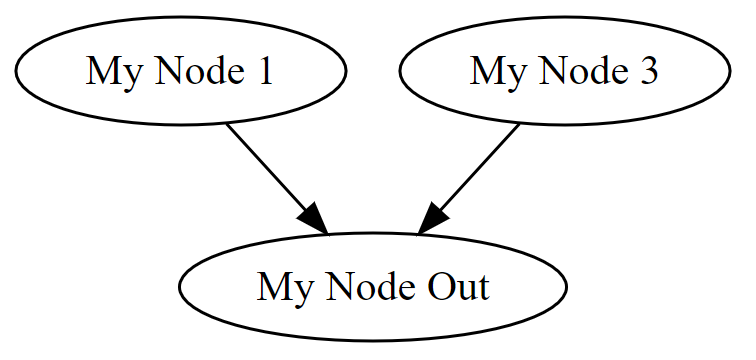
Nice! An easy way to visualize data relationships in your code…. done. GraphViz has many more features, and you can play with some examples on the above site too.j
Here is an example from the code snippet above. You are seeing the finished, correct version of the AST tree here. The interesting part of this exercise in visualizing my code was that the ‘|’ and ‘.’ operators in the graph were swapped - indicating that the ‘|’ had higher precedence in my syntax parser than the ‘.’. Fixing the preference order of the operators did not immediately fix the problem either, becuase I had actually broken the AST parsing of the operators.
Short story; visualize what you are doing - it can save a lot of time! It is certainly worth the 10 minutes of effort it takes to output your data as an image.
If you want to learn more about language parsing, the LLVM tutorial is quite nice - and a good refresher for me!:
digraph AST
{
Id_32 [label = "P:__anon__(), Fn:="];
Id_30 [label = "="];
Id_22 [label = "c1"];
Id_29 [label = "."];
Id_26 [label = "pat(...)"];
Id_23 [label = "c4"];
Id_24 [label = "e4"];
Id_25 [label = "g4"];
Id_28 [label = "gain(...)"];
Id_27 [label = "0.5"];
Id_32->Id_30;
Id_30->Id_22;
Id_30->Id_29;
Id_29->Id_26;
Id_29->Id_28;
Id_26->Id_23;
Id_26->Id_24;
Id_26->Id_25;
Id_28->Id_27;
}